


Q Trader
Le logiciel Trading Q Trader
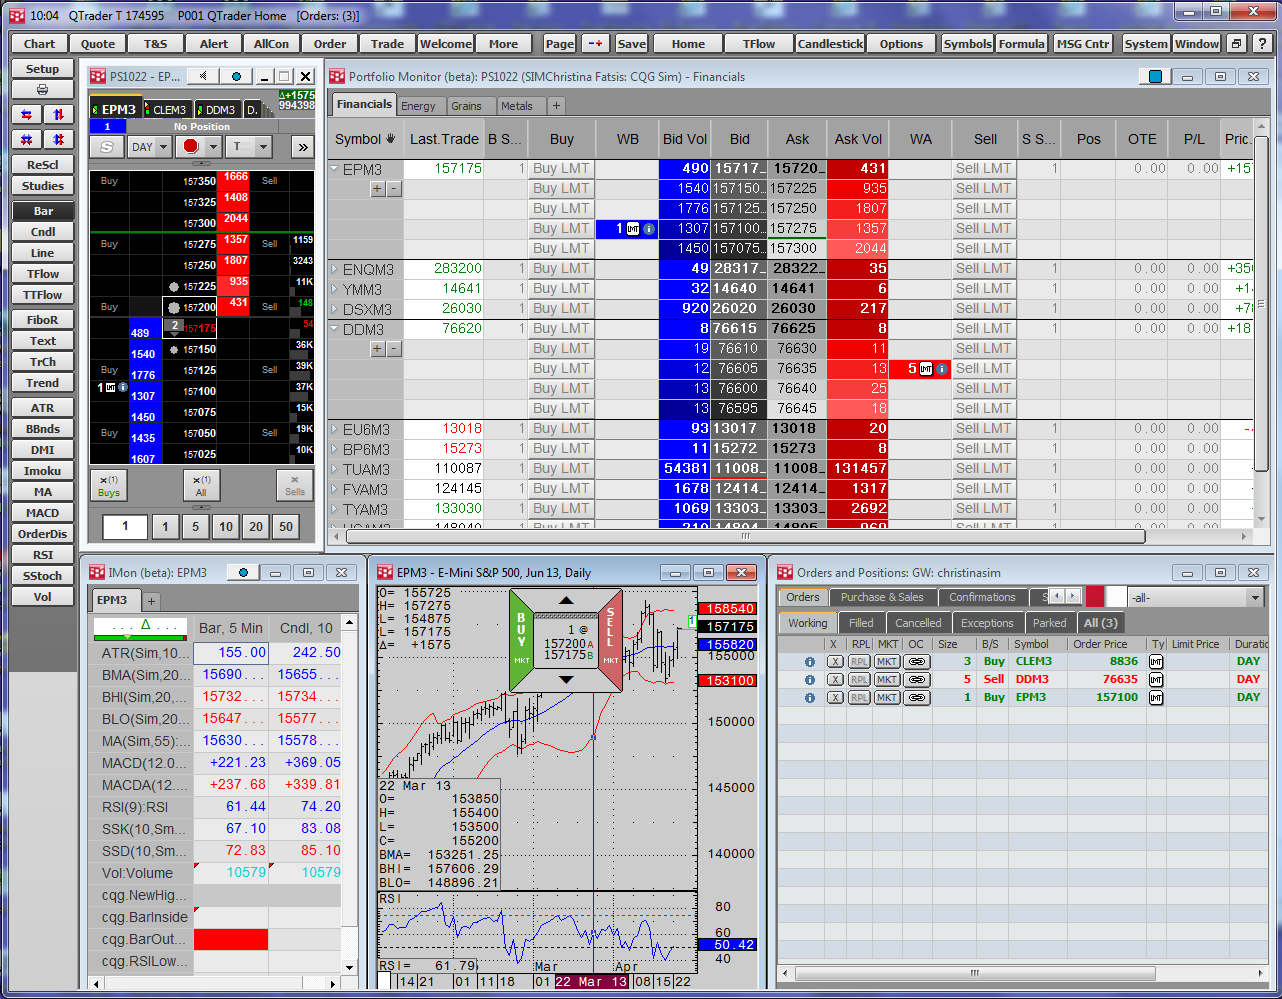
QTrader platform offers powerful trading tools and technical analysis features to trade and monitor the markets. Traders can easily view market activity, place orders, and track orders and positions.
QTrader offers powerful trading tools and technical analysis features to trade and monitor the markets. Traders can easily view market activity, place orders, & track orders and positions.
Electronic Trade Routing
Trading Tools - Order routing tools are easy to use, efficient, and provide key market information. Choose from the following interfaces in QTrader:
- Spreadsheet Trader: Customizable spreadsheet-based trading application that allows traders to track the state of a wide collection of markets using their favorite studies, conditions, and alerts.
- Order Ticket: Integrated depth-of-market and order management interface that minimizes use of screen real estate.
- DOMTrader®: Professional order-entry application that provides market transparency.
- Order Desk: Comprehensive desk-trader tool that attaches to any application, such as a quote board or a chart.
- SnapTrader®: Innovative interface designed to provide one-click trading functionality and increase screen space.
Orders and Positions - Monitor and manage futures accounts using real-time prices with Orders and Positions. The Trading Summary shows all daily trading activity by account or across all accounts. Account information can be exported to a Microsoft Excel® spreadsheet or as a HTML file.
Charting and Analytics
Chart Types:
- Bar: The bar chart displays classic open, high, low, and close values.
- Candlestick: Candlestick is a price pattern recognition technique based on one-, two-, or three-line patterns.
- Line: The line chart connects closing prices.
- TFlow®: TFlow bars are color-coded to show percentage of executed volume at the best bid and the best ask prices.
Instrument Monitor - The Instrument Monitor makes it possible to view market data, study values, and status of trader-defined conditions for an instrument in a single, comprehensive view. It enables a technical view of the markets using multiple time frames and chart types of a single instrument.
Features:
- Monitor the state of multiple conditions and study values for multiple chart types and intervals.
- Move through different instruments using tabs.
- Display all studies and conditions for a column in a chart.
- Set price, study, and condition alerts by instrument for an entire column or individual cell.
RealTimeData (RTD)
Deliver market data and other information to Excel using QTrader's RTD feature. Drive calculation formulas based on cells that reference real-time data. Request market data, historical data, and current working orders and positions data, including synthetic spreads.


Une Académie de Trading unique en France, accessible et ouverte à tous, au sein de laquelle une équipe de Traders professionnels et spécialisés vous forment aux métiers de la Finance.
