MarketDelta
Le logiciel Trading MarketDelta
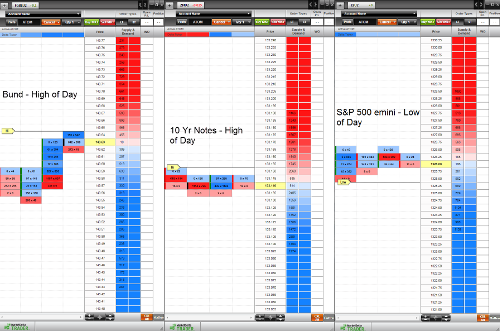
MarketDelta® Platform offers DOM trading, "footprints" feature (Bid/Ask, Delta & Volume) and automated order management tools; charting version also available. Multiple datafeeds available, including FREE version using CQG datafeed.
MarketDelta Trader is a powerful, easy to use trading platform that can be run stand alone or connected to MarketDelta Charts to provide a seamless data and trading interface. Leverage all the powerful and unique
tools MarketDelta offers, automated trading, and save money on data costs.
Many times the edge a trader possesses lies in the simplicity of use and design. The features of MarketDelta Trader have intentionally been kept simple and easy to use and leverage increased transparency by technology and design.Trading is hard enough, why should software be too? It's free, so give it a TRY!
Just a Sampling of MarketDelta® Trader Features:
Footprint Charts: The Footprint® chart is revolutionizing real time price transparency by displaying price AND volume activity and adding color to signify the dominant order flow at that point in time. Blue represents more aggressive buyers; red represents more aggressive sellers. The darker the shade of color the more dominant the order flow at that price.
Having this information at the point of execution is an invaluable because it shows the imbalances the moment they occur. The Footprint is a built in high frequency trade tracker because of how it displays the information, keeping you on top of the markets no matter what the condition.
3 Types of Footprints Included In MarketDelta Trader:
- Bid Ask Footprint® - This takes the volume and runs it through our order flow classification algorithm to determine if the trade was buyer motivated (traded at ask price) or seller motivated (traded at bid price). It is displayed as bid traded volume x ask traded volume.
- Delta Footprint® - Delta is the difference between bid and ask traded volume. The calculation is ask traded volume - bid traded volume. It will be either a positive or negative number. This Footprint type gives indication of the direct order flow coming into the market as buyers and sellers react. The value shown is the net buy or sell volume at each price.
- VolumeFootprint® - Displays the total volume traded at each price for the interval chosen. Good for monitoring how much volume is truly occurring and at which prices, as well as showing how much volume is trading at extremes.
Footprint® Features:
- Included Footprints are Bid/Ask, Delta, and Volume
- Chart Interval Types: Time, Volume, Tick Hi/Lo markers on chart for current session
- Delta ticker for bar by bar delta reading
- Current session data only; no backfilling currently
- Use Demo account with live data for training and simulation
- Two color schemas: blue/red or green/red
Automated Order Management Features:
- One single window controls everything, making it easy to manage and construct orders
- Simple On/Off switches to enable legs and settings
- Strategy Types: Profit target only, Stop loss only, Profit / Stop loss bracket (OCO), Trailing stop, Breakeven stop
- Values can be set using the up/down spinner or simply type in the amount
- Use Demo account with live data for training and simulation
- Automate up to 5 legs at once


